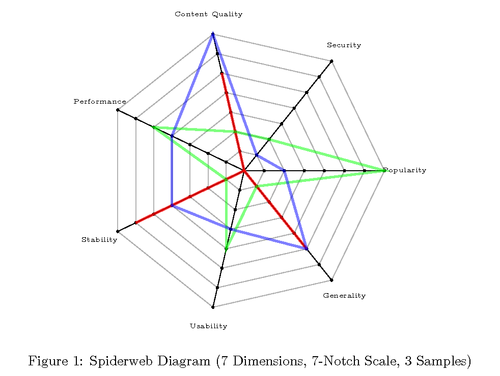
Such a diagram defines a set of dimensions D = {D1,...,Dn} and a common scale unit range from 0 to a maximal value U. Each individual sample contains a sequence of pairs (Dx,Vx) with 0 <= Vx <= U for all Dx in D.
The diagram is rendered as a spiderweb, where the D dimension axes meet each other in the origin in an angle of 360/D and are each divided in U units. Each sample is rendered as half-opaque colored path along the particular value unit nodes on each dimension. Overlapping parts will be rendered in a composite color.

Edit and compile if you like:
% Spiderweb Diagram
%
% Author: Dominik Renzel
% Date; 2009-11-11
\documentclass{article}
\usepackage[active,tightpage,floats]{preview}
\setlength\PreviewBorder{5pt}%


\usepackage{tikz}
\usetikzlibrary{shapes}

\begin{document}

\newcommand{\D}{7} % number of dimensions (config option)
\newcommand{\U}{7} % number of scale units (config option)

\newdimen\R % maximal diagram radius (config option)
\R=3.5cm
\newdimen\L % radius to put dimension labels (config option)
\L=4cm

\newcommand{\A}{360/\D} % calculated angle between dimension axes

\begin{figure}[htbp]
 \centering

\begin{tikzpicture}[scale=1]
  \path (0:0cm) coordinate (O); % define coordinate for origin

  % draw the spiderweb
  \foreach \X in {1,...,\D}{
    \draw (\X*\A:0) -- (\X*\A:\R);
  }

  \foreach \Y in {0,...,\U}{
    \foreach \X in {1,...,\D}{
      \path (\X*\A:\Y*\R/\U) coordinate (D\X-\Y);
      \fill (D\X-\Y) circle (1pt);
    }
    \draw [opacity=0.3] (0:\Y*\R/\U) \foreach \X in {1,...,\D}{
        -- (\X*\A:\Y*\R/\U)
    } -- cycle;
  }

  % define labels for each dimension axis (names config option)
  \path (1*\A:\L) node (L1) {\tiny Security};
  \path (2*\A:\L) node (L2) {\tiny Content Quality};
  \path (3*\A:\L) node (L3) {\tiny Performance};
  \path (4*\A:\L) node (L4) {\tiny Stability};
  \path (5*\A:\L) node (L5) {\tiny Usability};
  \path (6*\A:\L) node (L6) {\tiny Generality};
  \path (7*\A:\L) node (L7) {\tiny Popularity};

  % for each sample case draw a path around the web along concrete values
  % for the individual dimensions. Each node along the path is labeled
  % with an identifier using the following scheme:
  %
  %   D-, dimension  a number between 1 and \D (#dimensions) and
  %             value  a number between 0 and \U (#scale units)
  %
  % The paths will be drawn half-opaque, so that overlapping parts will be
  % rendered in a composite color.

  % Example Case 1 (red)
  %
  % D1 (Security): 0/7; D2 (Content Quality): 5/7; D3 (Performance): 0/7;
  % D4 (Stability): 6/7; D5 (Usability): 0/7; D6 (Generality): 5/7;
  % D7 (Popularity): 0/7
  \draw [color=red,line width=1.5pt,opacity=0.5]
    (D1-0) --
    (D2-5) --
    (D3-0) --
    (D4-6) --
    (D5-0) --
    (D6-5) --
    (D7-0) -- cycle;

  % Example Case 2 (green)
  %
  % D1 (Security): 2/7; D2 (Content Quality): 2/7; D3 (Performance): 5/7;
  % D4 (Stability): 1/7; D5 (Usability): 4/7; D6 (Generality): 1/7;
  % D7 (Popularity): 7/7
  \draw [color=green,line width=1.5pt,opacity=0.5]
    (D1-2) --
    (D2-2) --
    (D3-5) --
    (D4-1) --
    (D5-4) --
    (D6-1) --
    (D7-7) -- cycle;

  % Example Case 3 (blue)
  %
  % D1 (Security): 1/7; D2 (Content Quality): 7/7; D3 (Performance): 4/7;
  % D4 (Stability): 4/7; D5 (Usability): 3/7; D6 (Generality): 5/7;
  % D7 (Popularity): 2/7
  \draw [color=blue,line width=1.5pt,opacity=0.5]
    (D1-1) --
    (D2-7) --
    (D3-4) --
    (D4-4) --
    (D5-3) --
    (D6-5) --
    (D7-2) -- cycle;

\end{tikzpicture}
\caption{Spiderweb Diagram (\D~Dimensions, \U-Notch Scale, 3 Samples)}
\label{fig:spiderweb}
\end{figure}

\end{document}
Click to download: spiderweb-diagram.tex • spiderweb-diagram.pdf
Open in Overleaf: spiderweb-diagram.tex