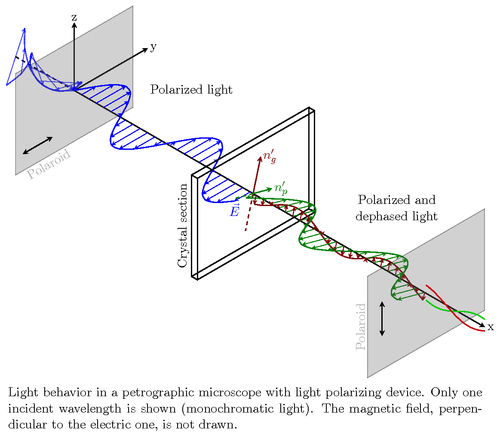
This TikZ code sketches the light behavior during its travel in a polarizing petrographic microscope when a birefringent crystal thin section is inserted between the polarizing devices.
The goal was to correctly show the vectorial relationships between light electric fields during its travel through the first polaroid, the mineral section and the second polaroid.

Edit and compile if you like:
% Polarizing microscope
% Author: Cyril Langlois
% This TikZ code sketches the light behavior during its travel in a polarizing
% petrographic microscope when a birefringent crystal thin section is inserted
% between the polarizing devices.
%
% The goal was to correctly show the vectorial relationships between light
% electric fields during its travel through the first polaroid, the mineral
% section and the second polaroid.
\documentclass[11pt]{article}
\usepackage{tikz}
\usetikzlibrary{arrows}
\usepackage[active,tightpage]{preview}
\PreviewEnvironment{tikzpicture}
\setlength\PreviewBorder{5pt}%


\begin{document}
\begin{tikzpicture}[x={(0.866cm,-0.5cm)}, y={(0.866cm,0.5cm)}, z={(0cm,1cm)}, scale=1.0,
    %Option for nice arrows
    >=stealth, %
    inner sep=0pt, outer sep=2pt,%
    axis/.style={thick,->},
    wave/.style={thick,color=#1,smooth},
    polaroid/.style={fill=black!60!white, opacity=0.3},
]
    % Colors
    \colorlet{darkgreen}{green!50!black}
    \colorlet{lightgreen}{green!80!black}
    \colorlet{darkred}{red!50!black}
    \colorlet{lightred}{red!80!black}

    % Frame
    \coordinate (O) at (0, 0, 0);
    \draw[axis] (O) -- +(14, 0,   0) node [right] {x};
    \draw[axis] (O) -- +(0,  2.5, 0) node [right] {y};
    \draw[axis] (O) -- +(0,  0,   2) node [above] {z};

    \draw[thick,dashed] (-2,0,0) -- (O);

    % monochromatic incident light with electric field
    \draw[wave=blue, opacity=0.7, variable=\x, samples at={-2,-1.75,...,0}]
        plot (\x, { cos(1.0*\x r)*sin(2.0*\x r)}, { sin(1.0*\x r)*sin(2.0*\x r)})
        plot (\x, {-cos(1.0*\x r)*sin(2.0*\x r)}, {-sin(1.0*\x r)*sin(2.0*\x r)});

    \foreach \x in{-2,-1.75,...,0}{
        \draw[color=blue, opacity=0.7,->]
            (\x,0,0) -- (\x, { cos(1.0*\x r)*sin(2.0*\x r)}, { sin(1.0*\x r)*sin(2.0*\x r)})
            (\x,0,0) -- (\x, {-cos(1.0*\x r)*sin(2.0*\x r)}, {-sin(1.0*\x r)*sin(2.0*\x r)});
    }

    \filldraw[polaroid] (0,-2,-1.5) -- (0,-2,1.5) -- (0,2,1.5) -- (0,2,-1.5) -- (0,-2,-1.5)
        node[below, sloped, near end]{Polaroid};%

    %Direction of polarization
    \draw[thick,<->] (0,-1.75,-1) -- (0,-0.75,-1);

    % Electric field vectors
    \draw[wave=blue, variable=\x,samples at={0,0.25,...,6}]
        plot (\x,{sin(2*\x r)},0)node[anchor=north]{$\vec{E}$};

    %Polarized light between polaroid and thin section
    \foreach \x in{0, 0.25,...,6}
        \draw[color=blue,->] (\x,0,0) -- (\x,{sin(2*\x r)},0);

    \draw (3,1,1) node [text width=2.5cm, text centered]{Polarized light};

    %Crystal thin section
    \begin{scope}[thick]
        \draw (6,-2,-1.5) -- (6,-2,1.5) node [above, sloped, midway]{Crystal section}
                -- (6, 2, 1.5) -- (6, 2, -1.5) -- cycle % First face
            (6,  -2, -1.5) -- (6.2, -2,-1.5)
            (6,   2, -1.5) -- (6.2,  2,-1.5)
            (6,  -2,  1.5) -- (6.2, -2, 1.5)
            (6,   2,  1.5) -- (6.2,  2, 1.5)
            (6.2,-2, -1.5) -- (6.2, -2, 1.5) -- (6.2, 2, 1.5)
                -- (6.2, 2, -1.5) -- cycle; % Second face

        %Optical indices
        \draw[darkred, ->]       (6.1, 0, 0) -- (6.1, 0.26,  0.966) node [right] {$n_{g}'$}; % index 1
        \draw[darkred, dashed]   (6.1, 0, 0) -- (6.1,-0.26, -0.966); % index 1
        \draw[darkgreen, ->]     (6.1, 0, 0) -- (6.1, 0.644,-0.173) node [right] {$n_{p}'$}; % index 2
        \draw[darkgreen, dashed] (6.1, 0, 0) -- (6.1,-0.644, 0.173); % index 2
    \end{scope}

    %Rays leaving thin section
    \draw[wave=darkred,   variable=\x, samples at={6.2,6.45,...,12}]
        plot (\x, {0.26*0.26*sin(2*(\x-0.5) r)},  {0.966*0.26*sin(2*(\x-0.5) r)});  %n'g-oriented ray
    \draw[wave=darkgreen, variable=\x, samples at={6.2,6.45,...,12}]
        plot (\x, {0.966*0.966*sin(2*(\x-0.1) r)},{-0.26*0.966*sin(2*(\x-0.1) r)}); %n'p-oriented ray
    \draw (10,1,1) node [text width=2.5cm, text centered] {Polarized and dephased light};

    \foreach \x in{6.2,6.45,...,12} {
        \draw[color=darkgreen, ->] (\x, 0, 0) --
            (\x, {0.966*0.966*sin(2*(\x-0.1) r)}, {-0.26*0.966*sin(2*(\x-0.1) r)});
        \draw[color=darkred,   ->] (\x, 0, 0) --
            (\x, {0.26*0.26*sin(2*(\x-0.5) r)}, {0.966*0.26*sin(2*(\x-0.5) r)});
    }

    %Second polarization
    \draw[polaroid]   (12, -2,  -1.5) -- (12, -2,   1.5)  %Polarizing filter
        node [above, sloped,midway] {Polaroid} -- (12, 2, 1.5) -- (12, 2, -1.5) -- cycle;
    \draw[thick, <->] (12, -1.5,-0.5) -- (12, -1.5, 0.5); %Polarization direction

    %Light leaving the second polaroid
    \draw[wave=lightgreen,variable=\x, samples at={12, 12.25,..., 14}]
        plot (\x,{0}, {0.966*0.966*0.26*sin(2*(\x-0.5) r)}); %n'g polarized ray
    \draw[wave=lightred,  variable=\x, samples at={12, 12.25,..., 14}]
        plot (\x,{0}, {-0.26*0.966*sin(2*(\x-0.1) r)});      %n'p polarized ray

    \node[align=justify, text width=14cm, anchor=north west, yshift=-2mm] at (current bounding box.south west)
        {Light behavior in a petrographic microscope with light polarizing
        device. Only one incident wavelength is shown (monochromatic light).
        The magnetic field, perpendicular to the electric one, is not drawn.};
\end{tikzpicture}
\end{document}
Click to download: polarizing-microscope.tex • polarizing-microscope.pdf
Open in Overleaf: polarizing-microscope.tex