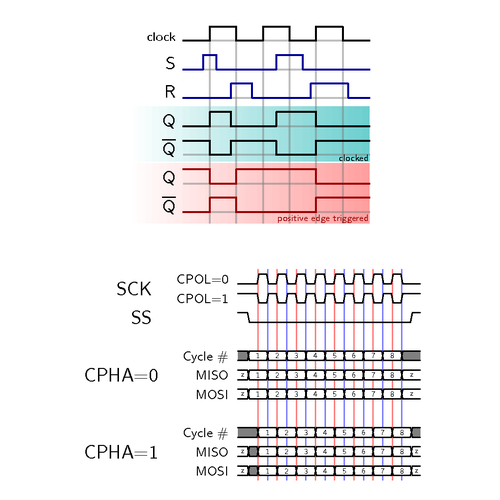
This example shows how to make a timing diagrams with the tikz-timing package. The timing diagrams were taken from an external source and redrawn in TeX to demonstrate the necessary steps.
The external sources are:
- http://commons.wikimedia.org/wiki/File:SR_FF_timing_diagram.png
- http://en.wikipedia.org/wiki/File:SPI_timing_diagram.svg
Timing diagrams like these can be done using the tikztimingtable environment which has the same syntax as a tabular environment with two columns. The first column holds the signal name, the second one the timing characters. See the package manual for detailed information about them.

Edit and compile if you like:
% TikZ-Timing v0.7 2009/12/09 Example 8 & 9:
% Author: Martin Scharrer
%
% This is an example for the 'tikz-timing' package.
% It redraws the timing diagram taken from
% http://commons.wikimedia.org/wiki/File:SR_FF_timing_diagram.png
% http://en.wikipedia.org/wiki/File:SPI_timing_diagram.svg
%
\documentclass{article}

\usepackage{tikz-timing}[2009/12/09]
% Use tikz-timing library 'counters' to define a counter character.
% This character draws a 'D{}' and increases the counter
% value by one. A reset character which resets the counter value
% (by default to 1) is also defined.
\usetikztiminglibrary[new={char=Q,reset char=R}]{counters}
\usepackage[active,tightpage]{preview}
\PreviewEnvironment{tikzpicture}
\setlength{\PreviewBorder}{5mm}
\pagestyle{empty}

\begin{document}
%
% Defining foreground (fg) and background (bg) colors
\definecolor{bgblue}{rgb}{0.41961,0.80784,0.80784}%
\definecolor{bgred}{rgb}{1,0.61569,0.61569}%
\definecolor{fgblue}{rgb}{0,0,0.6}%
\definecolor{fgred}{rgb}{0.6,0,0}%
%
\begin{tikztimingtable}[
    timing/slope=0,         % no slope
    timing/coldist=2pt,     % column distance
    xscale=2.05,yscale=1.1, % scale diagrams
    semithick               % set line width
  ]
  \scriptsize clock     & 7{C}                              \\
  S                     & [fgblue] .75L h 2.25L H LLl       \\
  R                     & [fgblue]  1.8L .8H 2.2L 1.4H 0.8L \\
  Q                     &          L .8H 1.7L 1.5H LL       \\
  $\overline{\mbox{Q}}$ &          H .8L 1.7H 1.5L HH       \\
  Q                     & [fgred]  HLHHHLL                  \\
  $\overline{\mbox{Q}}$ & [fgred]  LHLLLHH                  \\
\extracode
 \makeatletter
 \begin{pgfonlayer}{background}
  % Draw shaded backgrounds
  \shade [right color=bgblue,left color=white]
     (7,-8.45) rectangle (-2,-4.6);
  \shade [right color=bgred,left color=white]
     (7,-12.8) rectangle (-2,-8.6);
  % Add background grid lines
  \begin{scope}[gray,semitransparent,semithick]
    \horlines{}
    \foreach \x in {1,...,6}
      \draw (\x,1) -- (\x,-12.8);
    % similar: \vertlines{1,...,6}
  \end{scope}
  % Add labels
  \node [anchor=south east,inner sep=0pt]
    at (7,-8.45) {\tiny clocked};
  \node [anchor=south east,inner sep=0pt,fgred]
    at (7,-12.8) {\tiny positive edge triggered};
 \end{pgfonlayer}
\end{tikztimingtable}%
%
\begin{tikztimingtable}
  [timing/d/background/.style={fill=white},
   timing/lslope=0.2]
          CPOL=0 & LL 15{T} LL \\
          CPOL=1 & HH 15{T} HH \\
                 & H 17L H     \\
  \\
        Cycle \# & U     R 8{2Q} 2U    \\
            MISO & D{z}  R 8{2Q} 2D{z} \\
            MOSI & D{z}  R 8{2Q} 2D{z} \\
  \\
        Cycle \# & UU    R 8{2Q} U    \\
            MISO & D{z}U R 8{2Q} D{z} \\
            MOSI & D{z}U R 8{2Q} D{z} \\
\extracode
  % Add vertical lines in two colors
  \begin{pgfonlayer}{background}
    \begin{scope}[semitransparent,semithick]
      \vertlines[red]{2.1,4.1,...,17.1}
      \vertlines[blue]{3.1,5.1,...,17.1}
    \end{scope}
  \end{pgfonlayer}
  % Add big group labels
  \begin{scope}
    [font=\sffamily\Large,shift={(-6em,-0.5)},anchor=east]
    \node at (  0, 0) {SCK};    \node at (  0,-3 ) {SS};
    \node at (1ex,-9) {CPHA=0}; \node at (1ex,-17) {CPHA=1};
  \end{scope}
\end{tikztimingtable}%
\end{document}
Click to download: more-tikz-timing-examples.tex • more-tikz-timing-examples.pdf
Open in Overleaf: more-tikz-timing-examples.tex